
FP&A Guide: Financial Planning & Analysis for Modern Businesses
Financial Planning and Analysis (FP&A) is one of the most strategically important functions in a modern business, and one of the most misunderstood. Ask someone outside of finance what FP&A does, and you’ll likely hear something about spreadsheets and budget meetings. The reality is more sophisticated than that: FP&A answers the two questions every executive is constantly asking: where do we stand today against our targets, and where are we likely to end up?
Those are easy questions to ask, but getting reliable answers to them can be rigorous work. It requires pulling data from across the organization, building models that reflect how the business is performing, and translating the output into something leadership can act on. Done well, it can make the difference between a company that reacts to surprises and one that sees them coming.
In this guide, we’ll cover the basics of FP&A and take a look at where the practice is heading with modern tools. One solution is switching to Slash, a business banking dashboard that can streamline your financial operations.¹ With Slash, every transaction across your business is tracked and organized automatically. The platform aggregates all your spending and provides detailed reports and visual breakdowns of cash flow, payment method trends, and your highest-volume partners. You can get clear, data-driven insights at a glance instead of spending weeks pulling reports together manually.
See the ROI behind your spend
Use this calculator to understand impact, then manage and track it all in Slash.


What is FP&A (Financial Planning and Analysis)?
FP&A focuses on understanding and improving a company’s financial performance. While accounting records what has already happened and ensures accuracy and compliance, FP&A analyzes those results to explain why they happened and what comes next. The function typically sits within the finance organization, reporting to the CFO, and covers a range of tasks to inform better financial decision-making. Core components of FP&A include:
- Annual planning and budgeting: Building the financial plan for the year, with targets by department, product line, or business unit.
- Forecasting: Continuously updating that plan as actual results come in and conditions change.
- Scenario modeling: Preparing multiple views of the future and stress-testing assumptions.
- Variance analysis: Explaining the gap between plan and actuals with operational context alongside the numbers.
- Management reporting: Producing the monthly and quarterly packages that inform the CFO, CEO, and board.
- Business partnering: Working directly with sales, marketing, HR, and operations to make sure financial plans reflect operational reality.
The FP&A Process: 4 Essential Steps
Step 1: Data Collection and Consolidation
Before any analysis can happen, the data has to be gathered, cleaned, and made usable. In most organizations, this is harder than it sounds. Financial data lives in the ERP. Headcount data lives in the HRIS. Pipeline data lives in the CRM. Revenue metrics might live in a billing system. And somewhere, there are spreadsheets that only one person fully understands.
Pulling all of that together into a coherent dataset, reconciling different definitions of the same metric, and verifying accuracy is often where FP&A teams spend the majority of their time. That’s the problem industry professionals have been trying to solve and the primary driver behind investment in modern FP&A platforms.
Banking platforms like Slash can help reduce the collection burden: every transaction made across Slash cards, outbound payments, invoices, and integrated payment processors is tracked automatically in a single dashboard, giving finance teams a consolidated view of spend without extra work.
Step 2: Financial Planning and Forecasting
Planning is the annual process of setting your business’s financial targets, while forecasting is the ongoing process of updating those targets as reality unfolds. Both are core to FP&A, but they require different approaches:
Revenue forecasting
Revenue forecasting is typically the most sensitive part of the model, and often the hardest to get right. The most rigorous approach is driver-based forecasting: rather than projecting historical growth rates forward, you model the actual levers of the business. For a SaaS company, that might look like:
- Pipeline = Active sales reps × Quota × Attainment rate
- New bookings = Pipeline × Close rate × Average contract value
- Ending ARR = New bookings + Retained revenue − Churn
Cash flow projections
The P&L statement tells you if the business is profitable; the cash flow statement tells you if it can pay its bills. Timing mismatches between recognized revenue and collected cash, combined with capex commitments and debt service, can create liquidity crunches even in profitable businesses.
Tools that surface cash flow data in real time give teams a meaningful edge here. Slash’s analytics dashboard, for example, updates continuously with data on cash flow, spend by payment type, and highest-volume payment destinations, so finance teams aren’t waiting on a manual export to understand where money is moving.
Scenario planning
Scenario planning is the practice of building multiple versions of the forecast, typically a base case, an upside, and a downside, and stress-testing each. What happens to runway if a major customer leaves? What does the P&L look like if we enter a new market six months later than planned? Scenario planning turns forecasting from a prediction exercise into a decision support tool.
Step 3: Budgeting and Resource Allocation
The annual budget is still the financial backbone of most organizations, even as many teams move toward more continuous planning models. FP&A sits at the center of the budgeting process, translating operational plans into financial projections and reconciling them against top-down targets from leadership.
For most knowledge-work businesses, salaries and benefits represent the single largest line item in operating expenses, often dwarfing every other cost category combined. Most hiring decisions carry significant financial implications, and many financial models are ultimately built on headcount assumptions with revenue projections layered on top. FP&A teams deeply embedded in workforce planning tend to produce materially better forecasts than teams that treat headcount as a line item.
Rolling forecastsare increasingly replacing or supplementing the static annual budget. Rather than setting a plan in January and measuring against it all year, rolling forecasts update continuously, typically covering a 12 or 18-month forward view that refreshes monthly. This tends to make the forecast more operationally relevant, especially in businesses where conditions change quickly.
Step 4: Performance Analysis and Reporting
Once actuals are in, the work shifts to variance analysis: comparing results to plan, identifying what drove the differences, and updating the forward view accordingly. This is where FP&A’s value is most visible to leadership.
A good variance analysis goes beyond “revenue was $200K below plan.” It answers why:
- Was it a volume issue or a price issue?
- Was it concentrated in one segment, geography, or product?
- Was it a timing difference that will reverse next quarter, or a structural shift that changes the forecast?
That level of operational context requires FP&A to be tightly connected to the business as well as the accounting system.
KPI monitoring extends variance analysis across the full set of metrics that matter to the business: gross margin, net revenue retention, DSO, CAC, burn rate, and whatever else is specific to the company’s model. FP&A increasingly owns or co-owns the definition and tracking of these metrics, which can position the team as an authoritative source in the organization.
The standard in finance
Slash goes above with better controls, better rewards, and better support for your business.


Modern FP&A Tools and Technologies
With the sudden emergence of new financial technologies and AI, FP&A is evolving quickly. The core metrics haven’t changed, but the way finance teams calculate, analyze, and act on them has. With the right tools, businesses can produce more accurate insights in less time. Here’s what’s driving the changes:
From Spreadsheets to Cloud Platforms
Excel remains deeply embedded in FP&A, and it will be for some time. Its flexibility and near-universal familiarity make it well-suited to ad hoc analysis and rapid model-building. But as a primary planning infrastructure for a growing company, it can create problems: version control issues when multiple people are editing the same model, broken formulas that no one catches until a board meeting, zero audit trail, and knowledge concentration risk when the one person who understands the model leaves.
The response has been a wave of dedicated FP&A platforms, sometimes called CPM (Corporate Performance Management) tools, that sit on top of ERPs and automate the data connection, planning, and reporting layer. Enterprise-grade options include Workday Adaptive Planning, Anaplan, Planful, and Oracle Fusion Cloud EPM.
AI and Machine Learning in FP&A
AI adoption in FP&A is real, but it is still an emerging use case. According to the 2025 FP&A Trends Survey, 67% of teams using generative AI are applying it primarily to communication and decision support: generating narrative commentary, drafting board deck text, and summarizing variance explanations. Only 10% are using it for more advanced applications like predictive forecasting and scenario modeling. Here are some the areas where AI is making the most difference today:
- Automated variance narratives: AI tools can analyze month-over-month or plan-versus-actual changes and generate plain-language explanations of what drove them. The analyst’s job shifts to reviewing and refining the output rather than producing it from scratch.
- Predictive forecasting: Machine learning models can incorporate signals that traditional forecasts miss, including macroeconomic trends, seasonal patterns, and customer behavior, and adapt automatically when conditions change. Unlike a static Excel model, an AI forecast can learn from each new data point.
- Anomaly detection: AI systems trained on normal financial behavior can flag unusual transactions or unexpected variances before they become significant problems, improving both forecasting accuracy and financial integrity.
Slash users can connect our AI financial agent, Twin, to their financial stack to get detailed insights through simple conversation. Twin can analyze every transaction and generate custom views to help you understand the numbers behind your business, giving you access to advanced FP&A insights without relying on a full team of analysts.
Automation and Process Efficiency
Other forms of automation, including scheduled data pulls and pre-built ERP integrations, have already eliminated much of the manual work from FP&A processes. Routine tasks like pulling actuals from the accounting system, populating report templates, and distributing management packages can often be fully automated.
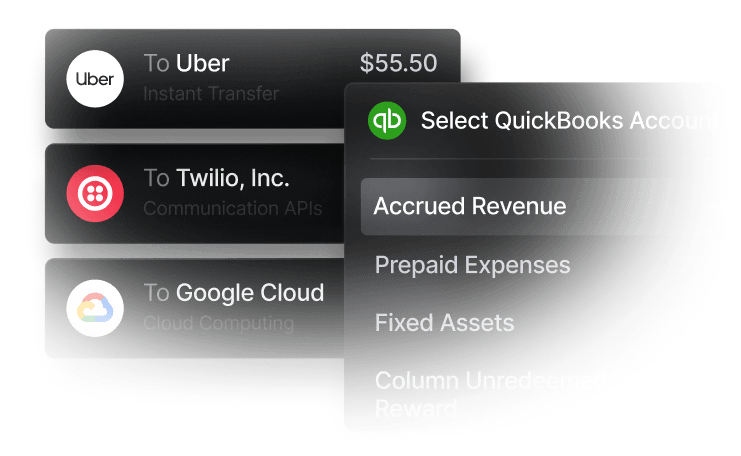
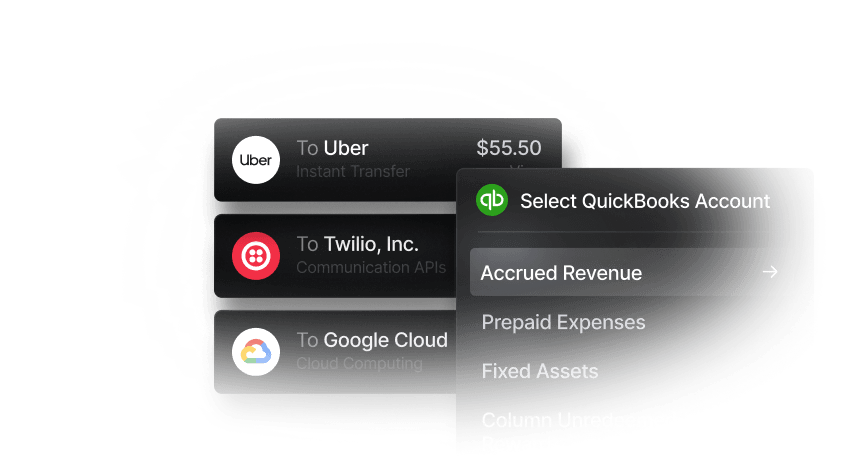
On the banking side, tight integrations between financial platforms and accounting software can close a lot of the gap between raw transaction data and clean financials. Slash integrates directly with QuickBooks, Xero, and Sage Intacct; every transaction is enriched in Slash with uploaded receipts, expense categories, and transaction details, all of which are exported automatically into your accounting software or ERP.
FP&A Challenges and Solutions for Growing Businesses
As businesses grow, FP&A becomes more valuable, but also more complex to manage. Without the right structure in place, finance teams can spend more time gathering and reconciling information than actually analyzing it. The most common challenges tend to fall into a few key areas, along with clear ways to address them:
- Data silos: When financial data lives in the ERP, operational metrics live in the CRM, and headcount data lives in spreadsheets that HR emails quarterly, every analysis requires manual reconciliation. The solution is both technical (integrations and data pipelines) and organizational (agreeing on a single source of truth for key metrics).
- Inconsistent metric definitions: FP&A teams that invest in codifying metric definitions and enforcing them across systems may spend far less time in terminology debates and far more time on analysis.
- Limited resources: A team of two or three covering budgeting, forecasting, analysis, and reporting for a $30M business has little margin for inefficiency. Modern platforms can compress the time cost of routine work enough to make the function viable at lean headcount, unlocking capabilities that would otherwise require a larger team.
- Forecasting accuracy: Models that worked well in stable conditions may fail when the business model shifts, a market disrupts, or external conditions change quickly. The best FP&A teams treat forecast accuracy not as a target to maximize but as a diagnostic tool; tracking where and why forecasts miss can help improve the underlying models and assumptions over time.
The Future of FP&A: Trends Shaping the Next Five Years
The most significant shift underway in FP&A is the move from hindsight to foresight. Traditional FP&A has been largely reactive; the team reports what happened last month and updates the plan accordingly. Modern FP&A, enabled by better data infrastructure and AI, can be predictive: monitoring leading indicators in real time, flagging emerging risks before they show up in the financials, and recommending actions rather than simply reporting results.
A related concept gaining traction is Extended Planning and Analysis (xP&A), a term coined by Gartner. The idea is that financial planning should not happen in isolation. Instead of finance creating a plan and handing it off to other teams, xP&A brings everyone into the same planning process.
In practice, this means connecting financial data with operational data across the business. Sales pipeline, hiring plans, marketing spend, and other inputs all feed into a shared model. When something changes, like slower deal velocity or a delayed hiring plan, the financial impact is reflected immediately.
The goal is to replace disconnected plans with a single, continuously updated view of the business. FP&A becomes less about reporting results after the fact and more about helping teams understand tradeoffs, test decisions, and stay aligned as conditions change.
Implementing Effective FP&A for Your Business
Building an effective FP&A function is an iterative process. Most teams do not get it right all at once, and trying to do everything at the same time often slows things down. The goal is to focus on the changes that will improve how decisions get made, then layer in additional structure as the business grows:
- Start with clean data: Before evaluating platforms, map out where your financial and operational data lives, how it’s defined, and how it gets from source systems into your models. The answers will clarify what you need from a platform and reveal the data governance work that needs to happen first.
- Prioritize the forecast over the budget: FP&A teams can spend a disproportionate amount of time on the annual budget, a document that can become outdated quickly, and insufficient time on the rolling forecast that informs ongoing decision-making. Rebalancing that investment often produces more strategic value.
- Connect finance to the business: The most valuable FP&A teams are actively looped into decision making, not just consulting during reviews. Showing up in sales reviews and product planning sessions, building enough operational literacy to understand what's actually driving the numbers, and asking the kinds of questions that surface assumptions a model would otherwise miss. The closer FP&A is to the business, the more accurate the forecast.
- Measure forecast accuracy: Track where your models are right and wrong over time. Consistent misses in a particular metric or business unit are a signal: either the model assumption is wrong, or something has changed in the business that needs to be understood. Forecast error analysis is one of the higher-ROI practices an FP&A team can adopt, and one of the least common.
Improve How Your Plan and Analyze Your Finances with Slash
Effective FP&A depends on having reliable, real-time financial data, and that starts with your banking infrastructure. Slash is built to give finance teams the visibility they need from the ground up.
Every transaction is captured automatically in a single dashboard, eliminating the manual extraction work that typically consumes a significant portion of FP&A time. The analytics dashboard updates in real-time with data on cash flow, spend by payment type, and highest-volume payment destinations, so your team can monitor the metrics that matter without waiting on a monthly close.
Slash also connects directly with the tools FP&A teams already rely on. Native integrations with QuickBooks, Xero, and Sage Intacct lets every transaction flow into your accounting software already enriched with uploaded receipts and transaction details. That means less time reconciling data between systems and more time on the analysis and strategic work that actually moves the business forward.
Here’s what else you get with Slash:
- Slash Visa® Platinum Card: Earn up to 2% cash back on business expenses, set customizable spending controls and limits, and issue unlimited virtual cards for your team members.
- Dynamic business banking: Open unlimited virtual accounts to separate operational funds and give teams clearer visibility into cash flow. Manage multiple business entities from a single dashboard, with consolidated reporting across accounts.
- Native cryptocurrency support: Convert funds into USD-pegged stablecoins such as USDT or USDC to send transfers on the blockchain, offering a near-instant international payment method with reduced fees and settlement times.⁴
- AI-powered financial tools: Use Twin, our built-in AI financial agent, to manage your Slash dashboard. You can ask it to create cards, pay invoices, review your cash flow, and much more.
- Invoice management: Create professional invoices using saved client details and collect payments through embedded links supporting ACH, wires, or cryptocurrency.
Apply in less than 10 minutes today
Join the 10,000+ businesses already using Slash.
The information in this article is intended for educational purposes. For specific financial planning advice, consult a qualified financial professional.
Frequently Asked Questions
What’s the difference between FP&A and accounting?
Accounting records and verifies what happened, with a focus on accuracy and compliance. FP&A uses that data to analyze what’s next and guide decisions.
The Best Accounting Automation Software Tools in 2026

Year-End Accounting Checklist: 12 Steps for Success

What skills are needed for effective FP&A?
Strong FP&A starts with financial modeling, Excel, and a solid grasp of accounting. Familiarity with data tools is increasingly important. Beyond that, the biggest differentiators are communication, business understanding, and the ability to focus on the insights that actually matter.
Cash Flow Management: A Guide for Making Smarter Business Decisions
Invoice Management: Streamline Processes, Reduce Errors, and Optimize Cash Flow


