
How to Build a 13-Week Cash Flow Forecast: Tips to Improve Your Business’s Projections
When managing a business, it’s smart to spend just as much time looking into the future as you do working in the present. However, some leaders end up dealing with too many current cash flow gaps to spend any time thinking ahead. As hectic as finances can seem, there’s a tried-and-true method of planning for the future in an organized format: the 13-week cash flow forecast.
The 13-week cash flow forecast is a weekly view of expected cash inflows and outflows over an upcoming quarter. It sits between the daily operational view and the longer annual budget, giving operators a window that is short enough to be accurate and long enough to be useful for planning. Restructuring advisors popularized the format decades ago because it tracks the metric that matters most when conditions tighten: liquidity. Today it is widely used by startups, growth-stage companies, and mature small businesses for the same reason.
This guide explains what a 13-week forecast is, why the format exists, how to build one, and the practices that tend to keep it accurate over time. We’ll also look at how Slash supports cash flow forecasting across different time horizons. With an integrated financial dashboard and an AI agent, Twin, you can analyze cash movement, surface trends, and build forward-looking projections without stitching together data from multiple systems.
The standard in finance
Slash goes above with better controls, better rewards, and better support for your business.

What Is a 13-Week Cash Flow Forecast?
A 13-week cash flow forecast lays out the cash a business expects to receive and the cash it expects to pay out, along with the projected ending cash balance for each week. The timeline corresponds to one calendar quarter, which is typically the longest window over which weekly cash movements can be estimated with reasonable confidence.
The forecast is built using the direct method, which means it tracks actual cash movements (customer payments received, payroll runs, vendor disbursements, tax payments) rather than starting from net income and adjusting. The direct method is well-suited to short-horizon planning because it focuses on timing, which is what determines whether a business has enough cash on a given day.
This is a different exercise from the cash flow statement that appears in financial reporting. A GAAP cash flow statement is historical and produced under the indirect method in most U.S. small businesses. A 13-week forecast is forward-looking and built from operational signals such as open invoices, payment terms, recurring obligations, and known one-time items.
Why are forecasts 13 weeks?
The 13-week window balances accuracy and usefulness. A two- or four-week view is usually accurate, but rarely long enough to inform planning decisions. A 12-month view is useful for strategy, but can lose fidelity at the weekly level because too many assumptions stack up. A quarter-long window can capture seasonal patterns, payment cycles, and most upcoming obligations while still being grounded in real receivables and payables.
The format also tends to align with the cadence many businesses already operate on. Vendor payment runs are often weekly, payroll is typically biweekly, and rent and major subscriptions usually fall on predictable monthly dates. A weekly grid makes it straightforward to slot these items in.
Common Components of 13-Week Forecast
A 13-week cash flow forecast is only as useful as the structure behind it. While formats can vary slightly between companies, most 13-week forecasts follow the same core structure. The sections below break down the key components and how each one contributes to an accurate view of short-term liquidity:
1. Beginning Cash Balance
This is the cash you have on hand at the start of each week. For the first week, it should reflect your actual current balance across all operating accounts. In the weeks that follow, it simply carries over from the prior week’s ending balance.
2. Cash Inflows
This section captures all incoming cash. In a 13-week forecast, the focus is less on when revenue is earned and more on when cash is actually expected to arrive. Estimates here are often based on accounts receivable aging, customer payment behavior, and any known upcoming transactions, with some buffer for delays where appropriate. Inflows may include:
- Customer collections from accounts receivable
- New sales paid at the time of order
- Refunds, rebates, or vendor credits received
- Interest or yield earned on operating accounts
- Loan proceeds, if scheduled
- Equity funding, if scheduled
- Tax refunds, if expected
3. Cash Outflows
This section captures all outgoing cash. Like inflows, timing plays a central role. Rather than spreading expenses evenly, forecasts are typically built around when payments are due or expected to be processed. This may involve pulling from accounts payable, payroll schedules, and recurring expense commitments to map out when cash will leave the business. Outflows may include:
- Payroll and related taxes
- Employee benefits
- Vendor payments from accounts payable
- Recurring software subscriptions
- Rent and utilities
- Marketing and advertising spend
- Loan payments and interest
- Estimated tax payments
- Capital expenditures
- Owner distributions or dividends
4. Net Cash Flow and Ending Cash Balance
For each week, subtract total outflows from total inflows to calculate net cash flow. Adding that to your beginning balance gives you the ending cash balance. That ending balance then becomes the starting point for the following week. Many businesses also set a minimum cash threshold to quickly identify any weeks where projected balances may drop too low.


How to Build a 13 Week Forecast: The 5 Step Process
A 13-week forecast can be built in a spreadsheet or in dedicated software, but the underlying process is largely the same. Regardless of the tool, the goal is to translate real financial data and expected activity into a clear, week-by-week view of cash flow. The work tends to break down into five core steps:
Step 1: Establish the Starting Cash Position
Start by pulling the current balance across all operating accounts. This typically includes your main checking account and any sub-accounts used to set aside funds for payroll, taxes, or vendor payments. Cash held in short-term treasury or yield accounts is often included if it can be accessed within the 13-week window, though some teams may track it separately for clarity. With Slash, you get next-day liquidity on treasury withdrawals, making it easy to deploy your idle capital for cash flow stability whenever needed.⁶
Step 2: Project Cash Inflows
Inflows are built around when cash is expected to arrive, not when revenue is recognized. The accounts receivable aging report is often the starting point, but it is rarely enough on its own. Payment timing often needs to be adjusted based on how customers behave, too.
Recurring or subscription revenue is typically more predictable, so at this point it's helpful to refresh your MMR. New sales can also be included, though they are often treated more conservatively, especially in the near-term where visibility is higher. The goal is to strike a balance between reflecting expected growth and avoiding overreliance on uncertain inflows.
Step 3: Project Cash Outflows
Outflows tend to be more controllable, but they still require careful timing. The accounts payable aging report provides a baseline for vendor payments, but actual payment timing may differ depending on internal processes or negotiated terms.
Payroll is usually one of the most stable line items, with known amounts and schedules. Taxes can be modeled based on prior payments or known deadlines. Recurring expenses like software subscriptions, rent, and utilities are typically straightforward once identified. Larger or less frequent items, such as capital expenditures or annual payments, are easy to miss but can have an outsized impact in a weekly forecast.
Step 4: Calculate Weekly Net Cash and Rolling Balance
With inflows and outflows in place, the forecast begins to take shape. Net cash flow for each week is calculated by subtracting outflows from inflows, and that result is added to the beginning balance to produce the ending balance.
Step 5: Identify Gaps and Test Scenarios
Once the baseline forecast is built, it becomes a tool for decision-making. The initial version shows what is expected to happen if everything goes to plan. From there, it is useful to test how changes in timing or performance would affect the outcome. Common scenarios include:
- A slowdown in customer collections
- A delay in a large receivable
- An unexpected one-time expense
- A delay in funding or financing
Running these scenarios helps clarify whether you have enough cushion or need to take action ahead of time. If a gap starts to emerge, Slash gives you a few practical ways to respond directly from your dashboard. You can adjust employee spend limits, tighten approval controls on outgoing payments, or draw on a tailored line of credit to bridge short-term shortfalls.¹, ⁵ It keeps the focus on making small, timely adjustments before a projected issue turns into a real one.
Possible Challenges When Creating a 13-Week Forecast
A 13-week cash flow forecast involves a lot of moving pieces, from timing assumptions to data inputs. Small gaps or inconsistencies can have an outsized impact on accuracy. Here are a few common pitfalls to watch out for:
- Using accrual figures instead of cash: Many teams pull data straight from the income statement, which records revenue when earned rather than when collected. The result is often a forecast that doesn’t match what actually hits the bank account.
- Forgetting non-operating cash movements: Loan principal payments, owner distributions, and capital expenditures can be material in a given week and are easy to miss because they don’t appear on the income statement.
- Leaving the forecast static: A 13-week forecast typically loses accuracy quickly if it is not updated. A weekly refresh that incorporates the prior week's actual results and rolls the window forward by one week is a common cadence.
- Not reconciling against actuals: Comparing each week's forecast to what actually happened, then noting the variance by category, is how the forecast gets more accurate over time. Without this loop, the same estimation errors tend to repeat.
- Over-reliance on point estimates: A single forecast number for a given week can give a false sense of precision. Showing a range, or running at least one downside scenario, can lead to better decisions.
How Often Should Your Team Update Its Forecast?
Many teams update a 13-week forecast on a weekly cadence, often on the same day each week so planning decisions are based on a consistent, current view. Each update typically involves three things: replacing the prior week’s projections with actual results, revisiting timing assumptions for receivables and payables, and extending the forecast by one week to maintain the full 13-week horizon.
Less frequent updates can work in more stable environments, but they tend to smooth over the timing differences that make this format valuable. The shorter the feedback loop, the easier it is to spot gaps between expected and actual cash movement.
Using Spreadsheets vs Forecasting Software
For smaller teams or earlier-stage companies, spreadsheets are often the starting point for your forecasting. They are familiar, and can give you a lot of powerful insights despite being such a lightweight tool. The trade-off is that data usually has to be gathered and updated manually, which can take time and increase the risk of working off outdated information.
Forecasting tools and integrated banking platforms approach this differently by pulling in balances, receivables, and payables automatically. This can help reduce the manual work of data collection and keep the forecast more accurate with up-to-date information.
How Slash Can Help Businesses Optimize Their Cash Flow
Some companies need just as much help managing their current cash flow as they do forecasting their future cash flow. This starts with their financial infrastructure.
Slash’s analytics dashboard pulls from transactions, cards, and accounts across your organization to give you a consolidated view of how money is moving in real time. Instead of stitching together reports, you can see trends, monitor spending patterns, and track inflows and outflows in one place.
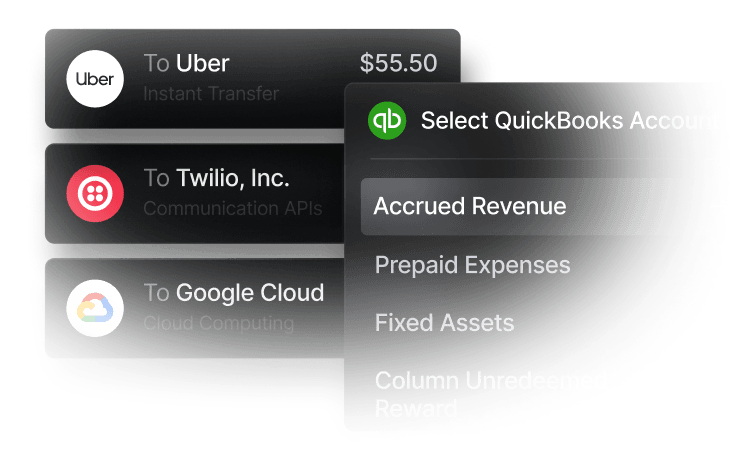
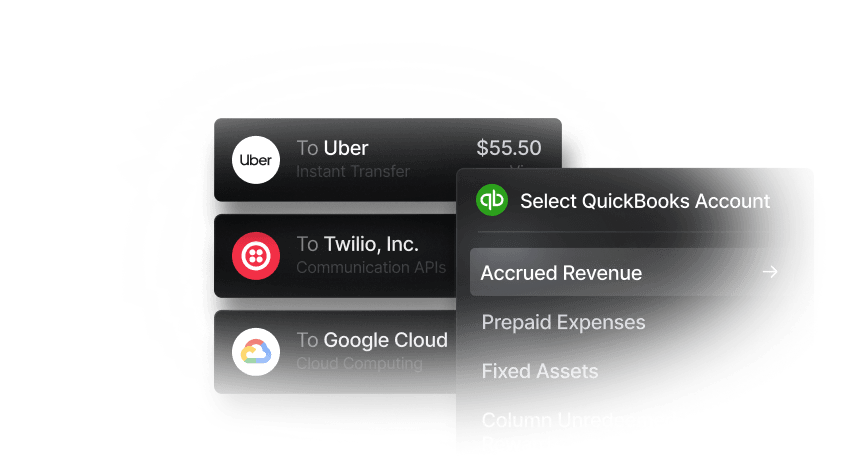
Direct, two-way integrations with QuickBooks, Xero, and Sage Intacct keep your accounting data in sync, so your forecasts are based on current information rather than static snapshots. For teams building and maintaining a 13-week forecast, that consistency makes it easier to spot changes early and adjust with confidence.
When you’re ready to dive into a deeper, forward-looking analysis of your finances, you can talk to Twin. Twin is an AI financial assistant that you can prompt to break down complicated financial analysis for you in plain English or generate custom graphical views of your company’s financial trends. Not only can Twin help with analysis, it can also execute payments end-to-end, make purchases for you only, and more just through conversation.Here’s what else you get with Slash:
- Slash Visa® Platinum Card: The Slash Card allows you to set customizable spending controls and issue unlimited virtual cards for handling team expenses, vendor payments, subscriptions, and more. Users can also earn up to 2% cash back on business purchases.
- High-yield treasury: Earn up to 3.82% annualized yield on idle funds with money market investments from BlackRock and Morgan Stanley, managed directly within your Slash account.
- Accounting & ERP integrations: Sync transaction data with QuickBooks Online, Xero, or Sage Intacct to streamline reconciliation, reporting, and month-end close.
- Native cryptocurrency support: Hold, send, and receive USD-pegged stablecoins USDC and USDT across eight supported blockchains for faster, lower-cost global payments.⁴
- Diverse payment methods: Slash supports a wide range of payments, including card spend, global ACH, international wire transfers to over 180 countries via SWIFT, and real-time domestic payments through RTP and FedNow.
Apply in less than 10 minutes today
Join the 10,000+ businesses already using Slash.
Frequently Asked Questions
Is a 13-week cash flow forecast the same as a cash flow statement?
No. A cash flow statement is a historical financial report that summarizes cash movements over a past period. A 13-week forecast is a forward-looking weekly projection. The two can complement each other, but they answer different questions. The cash flow statement looks back, and the forecast looks ahead.
Cash Flow Management: A Guide for Making Smarter Business Decisions

How accurate should the forecast be?
Accuracy typically improves over time. Teams may aim for variance under 5 percent in the first four weeks, under 10 percent in weeks five through eight, and under 15 percent in weeks nine through 13. The early weeks are usually the most accurate because they rely on known invoices and bills. Later weeks rely more on estimates and tend to drift.
What if the forecast shows a cash shortfall in a future week?
That is exactly the type of issue a forecast is supposed to surface. Catching a shortfall early gives you time to respond before it becomes a real constraint for your business. Depending on the situation, that might involve accelerating collections, adjusting payment timing with vendors, reducing discretionary spend, or using a working capital facility to bridge the gap.
Do I need software to build a 13-week forecast?
Not necessarily. Many teams start with a spreadsheet, especially when the number of accounts and assumptions is manageable. As complexity increases, dedicated tools can help reduce the manual work of gathering and updating data each week and keep the forecast aligned with current financial information.
The Top 7 Platforms for Integrated Treasury, Forecasting, and High-Yield Accounts

Read more from us


